Calculator Online
 Sign In
Pages
Category
 AI Tools
 Health
 Math
Math Everyday Life
 Finance
 Physics
 Chemistry
 Statistics
 Construction
 Pets
Pets Time & Date
Follow Us On:
Calculator Online
Pages
Category
Follow Us On:
Enter your dataset, select whether it’s a sample or population, click "Calculate" to instantly see the standard deviation, variance, mean, sum, and error margin.
Related
This standard deviation calculator quickly finds how spread out the numbers are in a dataset. It shows you whether the data values are clustered closely around the mean or widely scattered. The tool also provides the mean, variance, coefficient of variation, standard error of mean, and step-by-step calculations. This makes it an ideal tool for students, teachers, and professionals who require fast and reliable results.
Standard Deviation (σ) measures how much individual data points vary from the mean. Standard deviation measures how spread out your data is.
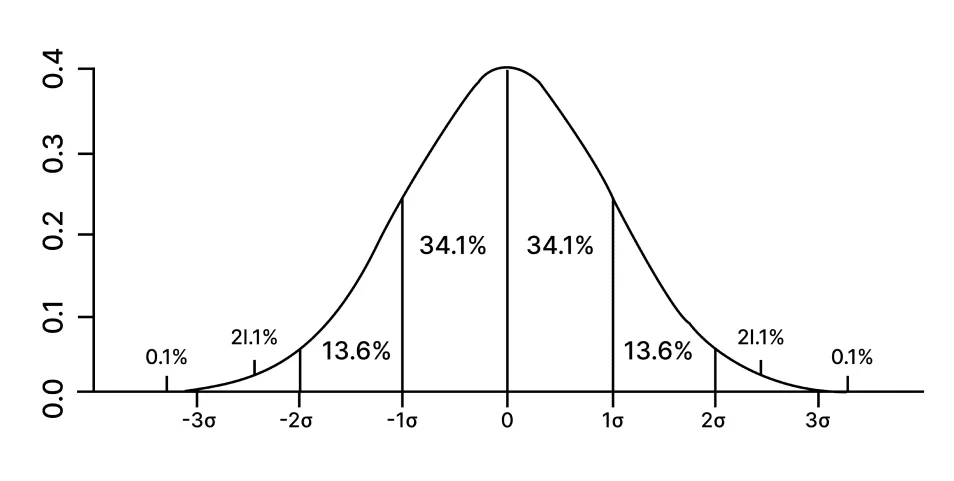
A low standard deviation means the values are close to the mean, while a high standard deviation indicates that the values are more spread out. This concept is widely used across different fields:
Now, check out the table below to clearly see the differences between the sample and population standard deviation:
| Criterion | Sample Standard Deviation (s) | Population Standard Deviation (σ) |
|---|---|---|
| Formula | \(s = \sqrt{\dfrac{1}{n – 1} \displaystyle\sum_{i=1}^n\left(x_{i} – \bar{x}\right)^2}\) | \(σ = \sqrt{\dfrac{1}{N} \displaystyle\sum_{i=1}^N\left(x_{i} – μ\right)^2}\) |
| Use Case | Used when only a subset of the total population is sampled | Used when the entire population data is available |
| Example | Analyzing test scores of 30 students in a class | Analyzing test scores of all students in a school |
| Application | Useful in studies, surveys, and research | Useful in complete data analysis, such as census data |
| Bias Adjustment | Divides by \(n - 1\) to correct bias | Divides by \(N\), assuming all data points are known and included |
| Calculation | Typically used when sampling data | Used for calculating exact statistics from a full population |
When all the members of the population can be sampled, then the following standard deviation formula is used:
\(\sigma = \sqrt{\dfrac{1}{N} \sum_{i=1}^{N} (x_i - \mu)^2}\)
The given formula is used for finding the standard deviation of a sample (subset of data drawn from the population):
\(s = \sqrt{\dfrac{1}{n-1} \sum_{i=1}^{n} (x_i - \bar{x})^2}\)
Follow these steps to learn how to find the standard deviation manually:
1. Calculate the Mean:
Find the average of the data set by adding all values and dividing by the total number of values.
2. Find the Distance from the Mean:
Subtract the mean from each value in the data set.
3. Square Each Distance:
Square the result of each distance calculated in step 2.
4. Sum the Squared Values:
Add up all the squared distances.
5. Calculate Variance:
6. Find the Standard Deviation:
Take the square root of the variance. The result is the standard deviation.
Suppose you have a data set (3, 4, 9, 7, 2, 5 ), find its standard deviation.
Solution:
Step #1(Calculate Mean Value):
\(\bar{x} = \frac{3 + 4 + 9 + 7 + 2 + 5}{6}\)
\(\bar{x} = \frac{30}{6} \)
\(\bar{x} = 5\)
Step 2: Calculate The Value Of \(x_i - \bar{x}\)
| Data Values (xi) | xi - x̅ | (xi - x̅ )2 |
|---|---|---|
| 3 | 3 - 5 = -2 | (-2)2 = 4 |
| 4 | 4 - 5 = -1 | (-1)2 = 1 |
| 9 | 9 - 5 = 4 | (4)2= 16 |
| 7 | 7 - 5 = 2 | (2)2 = 4 |
| 2 | 2 - 5= -3 | (-3)2= 9 |
| 5 | 5 - 5 = 0 | (0)2 = 0 |
Step 3: (Sum of Squared Deviations):
4 + 1 + 16 + 4 + 9 + 0 = 34
Step 4: Variance
For sample (n = 6):
\(s^2 = 34/(6-1) = 6.8\)
For population (N = 6):
\(\sigma^2 = 34/6 = 5.67\)
Step 5: Standard Deviation
Sample:
\(s = \sqrt{6.8} \approx 2.61\)
Population:
\(\sigma = \sqrt{5.67} \approx 2.38\)
Follow the steps below to calculate the Standard Deviation using our SD calculator:
1. Input format: Enter numbers separated by commas, or spaces.. You can use decimals and negative values. Example inputs:
12, 23, 45, 33, 65, 54, 54
12, 23, 45, 33, 6.5, 5.4, 54
12, 23, 45, 33, 6.5, -5.4, -54
2. Choose Options: Select sample (uses n - 1) or Population (uses N) before calculating
3. Tip: Choose the sample standard deviation calculator option to compute results if your data is a subset of a larger population
4. Click "CALCULATE" to view the results
5. Outputs shown: Standard deviation (σ or s), variance, mean, coefficient of variation, standard error of the mean, and a step-by-step calculation breakdown
6. Export/copy results: Use the Copy or Download buttons to save your outputs
Variance measures the squared deviations from the mean, while standard deviation is the square root of variance. The variance is measured in square units. On the other hand, the standard deviation gives the result in the original units so that it can be easily interpreted.
The standard deviation shows the spread of data points around a mean, while the standard error defines how far the mean is from the actual population mean. It helps to build the confidence interval, which shows the range where the original mean lies.
It is the ratio of the standard deviation to the mean, shown as a percentage. With it, you can easily compare the variability between datasets having different units or scales.
Calculating standard deviation helps in understanding the variability in the different datasets, assessing the reliability of data, or consistency within a dataset.
No, the standard deviation is derived from the square root of the variance, and since the variance is always a non-negative number, the standard deviation can never be a negative number. The smallest value is zero, which only occurs when all the dataset values are the same.
For a sample, use =STDEV.S(range)
For an entire population, use =STDEV.P(range)
They are the data points that are different from your observation. The way to handle them depends on their cause and effect.
If your data has an outlier, then perform the following steps:
Related
Add this calculator to your site.
×Just copy a given code & paste it right now into your website HTML (source) for suitable page.
Preview:


Easter into Action, Save With Satisfaction
UPTO
50 %
OFF
Give Us Your Feedback
Share Result
Standard Deviation Calculator

Links
Home Conversion Calculator About Calculator Online Blog Hire Us Knowledge Base Sitemap Sitemap TwoEmail us at
Contact Us© Copyrights 2026 by Calculator-Online.net
How was your experience today?
Not now
Awesome! Would you mind sharing that on Trustpilot?
Your review helps others find a tool that actually works.
Write a Review on TrustpilotNot now
Sorry to hear that
Tell us what went wrong — we read every message.
Not now
Thanks for your feedback!
We'll use it to make things better.